What goes in?
Experimental spectroscopic data collected along a controlled perturbation — here, FTIR spectra recorded as pressure increases.

Advanced spectroscopic analysis · reproducible scientific workflow
A series of in situ FTIR spectra recorded at increasing pressure contains more than a growing band. 2D-IRIS inversion resolves that series along a model-defined adsorption-affinity coordinate. Illustrated here with the Ba-GIS data set.
Experimental FTIR spectra → 2D-IRIS inversion → Regularisation & validation → Energy-resolved distribution → Scientific interpretation
Experimental spectroscopic data collected along a controlled perturbation — here, FTIR spectra recorded as pressure increases.
Apply and validate the 2D-IRIS inversion methodology, with every setting and check recorded.
An energy-resolved representation that reveals information difficult to extract from the spectra alone.
Inspecting spectra one by one shows how a band grows with pressure, but overlapping contributions that respond differently to pressure remain entangled. Adsorption environments with distinct affinities can share the same spectral region.
2D-IRIS asks a more specific question: which combination of contributions, each following a Langmuir-type response with its own apparent affinity, reproduces the whole experimental series at every wavenumber? The answer is a distribution over wavenumber and a reduced adsorption free energy, ΔadsG°/RT.
A pressure-resolved series of in situ FTIR spectra of adsorbed CO₂, taken from the collaborative Ba-GIS research data.
DataChem applies the 2D-IRIS inversion to this series: a physical model of how each contribution responds to pressure, fitted under a regularisation constraint that keeps the result numerically stable. Every choice below is recorded and checked, not left as a hidden default.
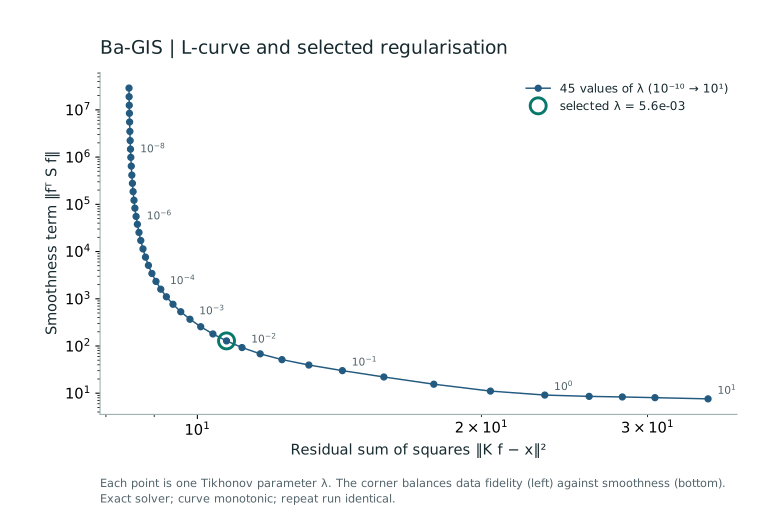
Two checks accompany the result: is the regularisation strength well chosen, and does the model actually reproduce the measured spectra?
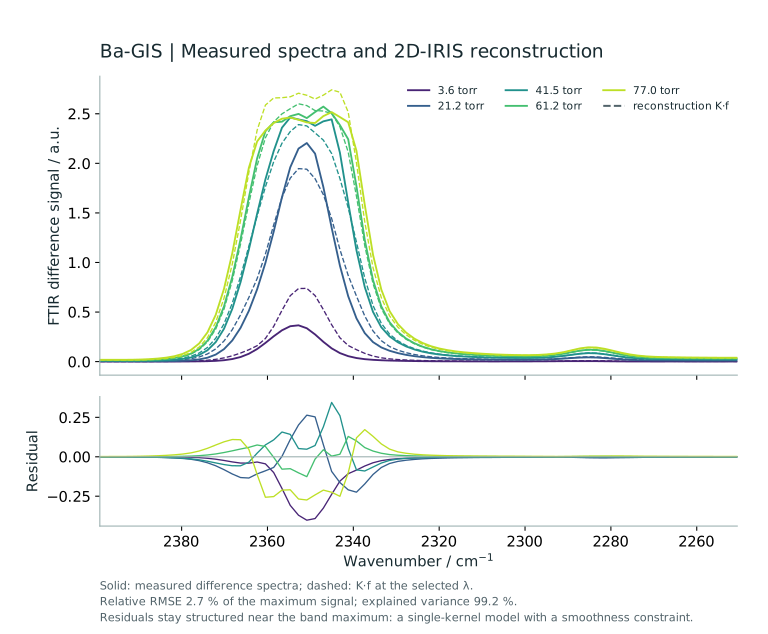
The reconstruction explains most of the series (99.2 % of the variance), but the residuals stay structured near the band maximum: the model does not reproduce every detail of the measured spectra. This is expected from a single Langmuir kernel under a smoothness constraint, and it is part of judging the inversion critically — a high explained-variance figure is a useful check, not proof that the model is a physically perfect description of the system.
The energy-resolved representation of the Ba-GIS series, at the regularisation validated above.
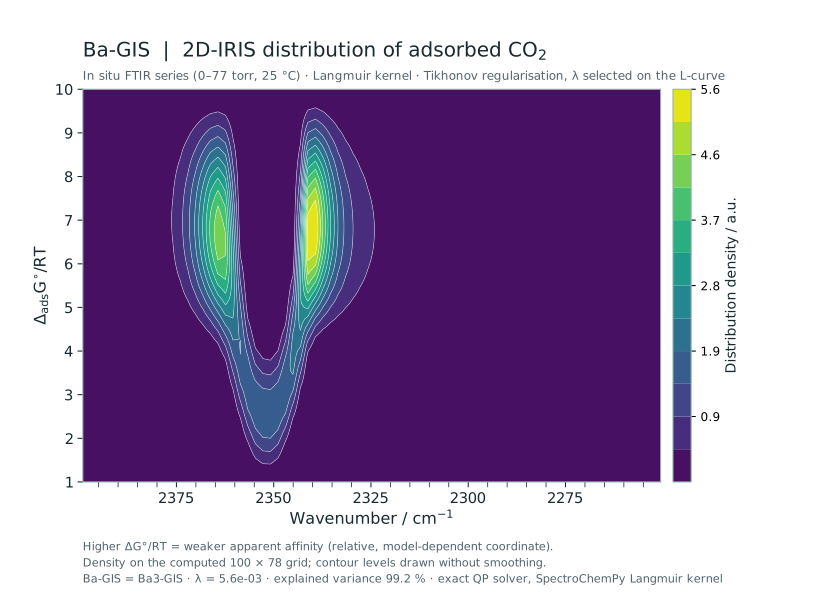
What the representation adds compared with reading the spectra directly.
The distribution separates contributions by how they respond to pressure, not only by where they absorb. Regions of the map at high ΔadsG°/RT gather signal whose intensity keeps growing almost linearly over the measured pressure range; regions at low ΔadsG°/RT gather signal that saturates early. In the Ba-GIS series this contrast is visible within a single spectral band: the centre near 2350 cm⁻¹ behaves differently from the flanks near 2364 and 2339 cm⁻¹.
This is complementary to the MCR-ALS resolution of the same series: MCR-ALS separates spectral shapes, 2D-IRIS resolves the pressure dependence along an explicit model coordinate. Both remain descriptions of the data, and their agreement or disagreement is itself informative.
The Ba-GIS case study places this result alongside PCA, MCR-ALS and independent equilibrium measurements: see the study →
An inversion is only as meaningful as its assumptions. They are stated explicitly.
2D-IRIS is a scientific analysis methodology implemented by DataChem through a documented Python workflow, not a stand-alone software product.
Source file hashes, software versions, spectral window, pressures, kernel, energy grid, λ grid, selected λ and its selection rule, residuals, reconstruction and the full distribution as CSV.
The distribution and L-curve as numerical tables, publication-quality figures, and a written interpretation that states what the result supports and what it does not.
DataChem can adapt this type of workflow to experimental spectroscopic datasets when the perturbation variable and the physical model are appropriate — for example other spectroscopies (Raman, NIR) or other variables such as dose, time or temperature.
Method reference: Study of the diffusion properties of zeolite mixtures by combined gravimetric analysis, IR spectroscopy and inversion methods (IRIS), PCCP, 2023.
Collaborative research: Ba-exchanged gismondine for CO₂ direct air capture (DAC), J. Mater. Chem. A, 2026. Data analysis: Abdelhafid Ait Blal. These figures do not represent a DataChem client assignment.